Worst Air Quality Cities in the World: AQI Trends 2005–2025
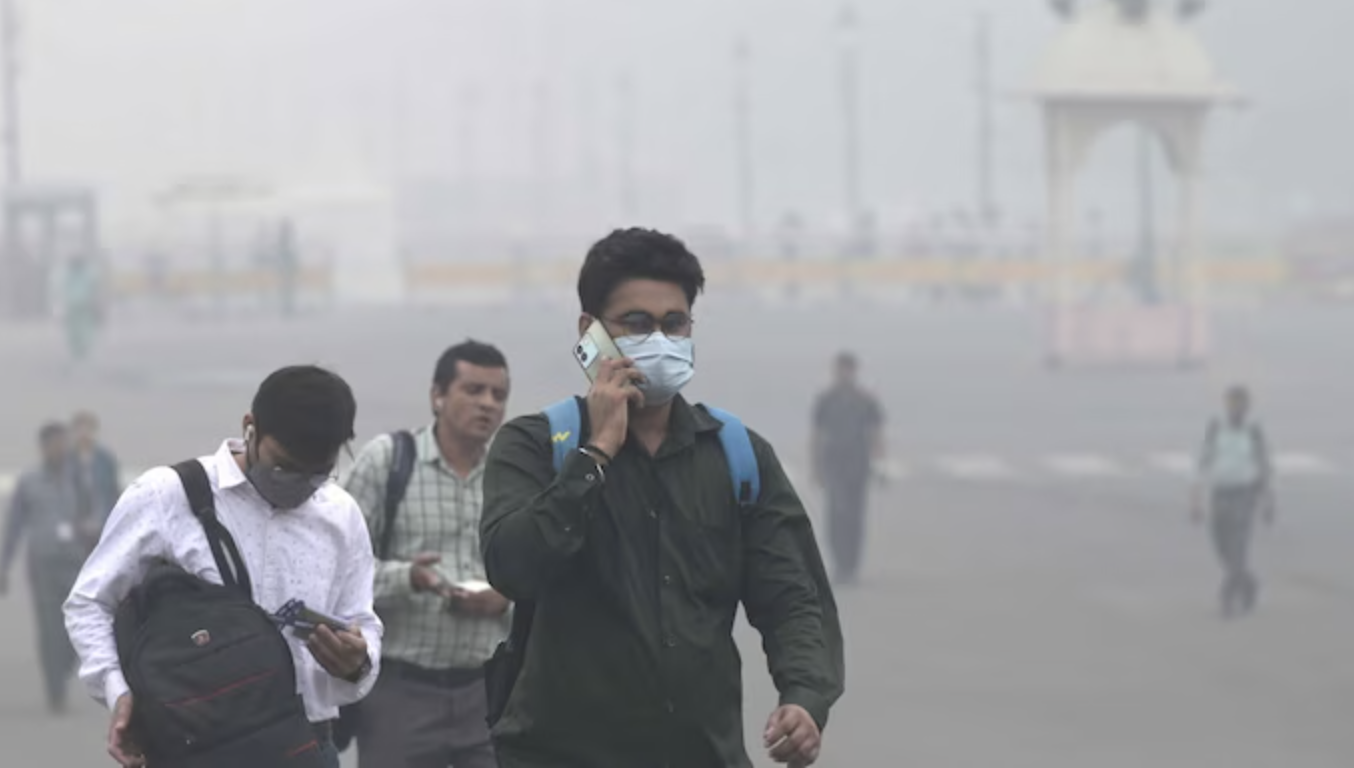
Over the last 20 years global exposure to fine particulate matter (PM2.5) has remained high, with most of the world’s worst-ranking cities concentrated in South Asia; some places (notably many Chinese cities) have seen large, policy-driven improvements since the 2010s, while others (many South Asian and some African cities) have seen little or no improvement — or have worsened. This article documents the major 20-year patterns, ranks the worst cities (using the latest IQAir/World Air Quality Report data), explains why trends differ, and summarizes government and citizen measures to fight air pollution in 2025.
Methods, data sources and caveats
This article synthesizes publicly available monitoring and modelled data and peer-reviewed assessments from global datasets and reports (notably IQAir’s World Air Quality Report / live city rankings, the WHO Ambient Air Quality Database and data portals, World Bank analyses, and peer-reviewed studies on policy impacts). Where I cite a ranking I use IQAir’s most recent city rankings (World Air Quality Report 2024 and the site’s live lists); for long-run policy impact and national trend evidence I rely on WHO/World Bank and peer-reviewed assessments (PNAS, Nature and other studies) that evaluated policy effects. Note: annual city rankings can change year-to-year (monitoring coverage, local weather and short-term episodes matter); this article reports the long-run (≈2005–2025) picture and gives the 2024/2025 status where possible.
Big-picture 20-year trends (2005→2025)
a. Global exposure remains far above WHO guidance. The WHO’s database and global assessments emphasize that a very large share of the world’s population breathes air that exceeds WHO PM2.5 guidelines, and monitoring coverage has expanded but still leaves gaps in many regions according to
b. Regional divergence: since roughly 2013–2014 a noticeable global divergence has appeared — China and some high-income cities implemented large national and city policies and cut PM2.5 substantially, while South Asia (India, Pakistan, Bangladesh) and some parts of Africa have remained heavily polluted or worsened in many urban areas. Peer-reviewed analyses estimate China’s population-weighted PM2.5 exposure fell by ~30–42% between 2013 and 2020/2021 because of targeted policies; that decline accounts for much of the global improvement seen in several datasets. More here AQLI
Ranking: worst cities over the last 20 years & their 2025 status
IQAir’s city rankings (2024 World Air Quality Report and live city list) provide the most widely-cited recent city list. Below are the top cities that have been ranked among the world’s worst in the last few years, plus a short 2025 status note:
Top 10 (representative recent ranking from IQAir’s 2024 city data)
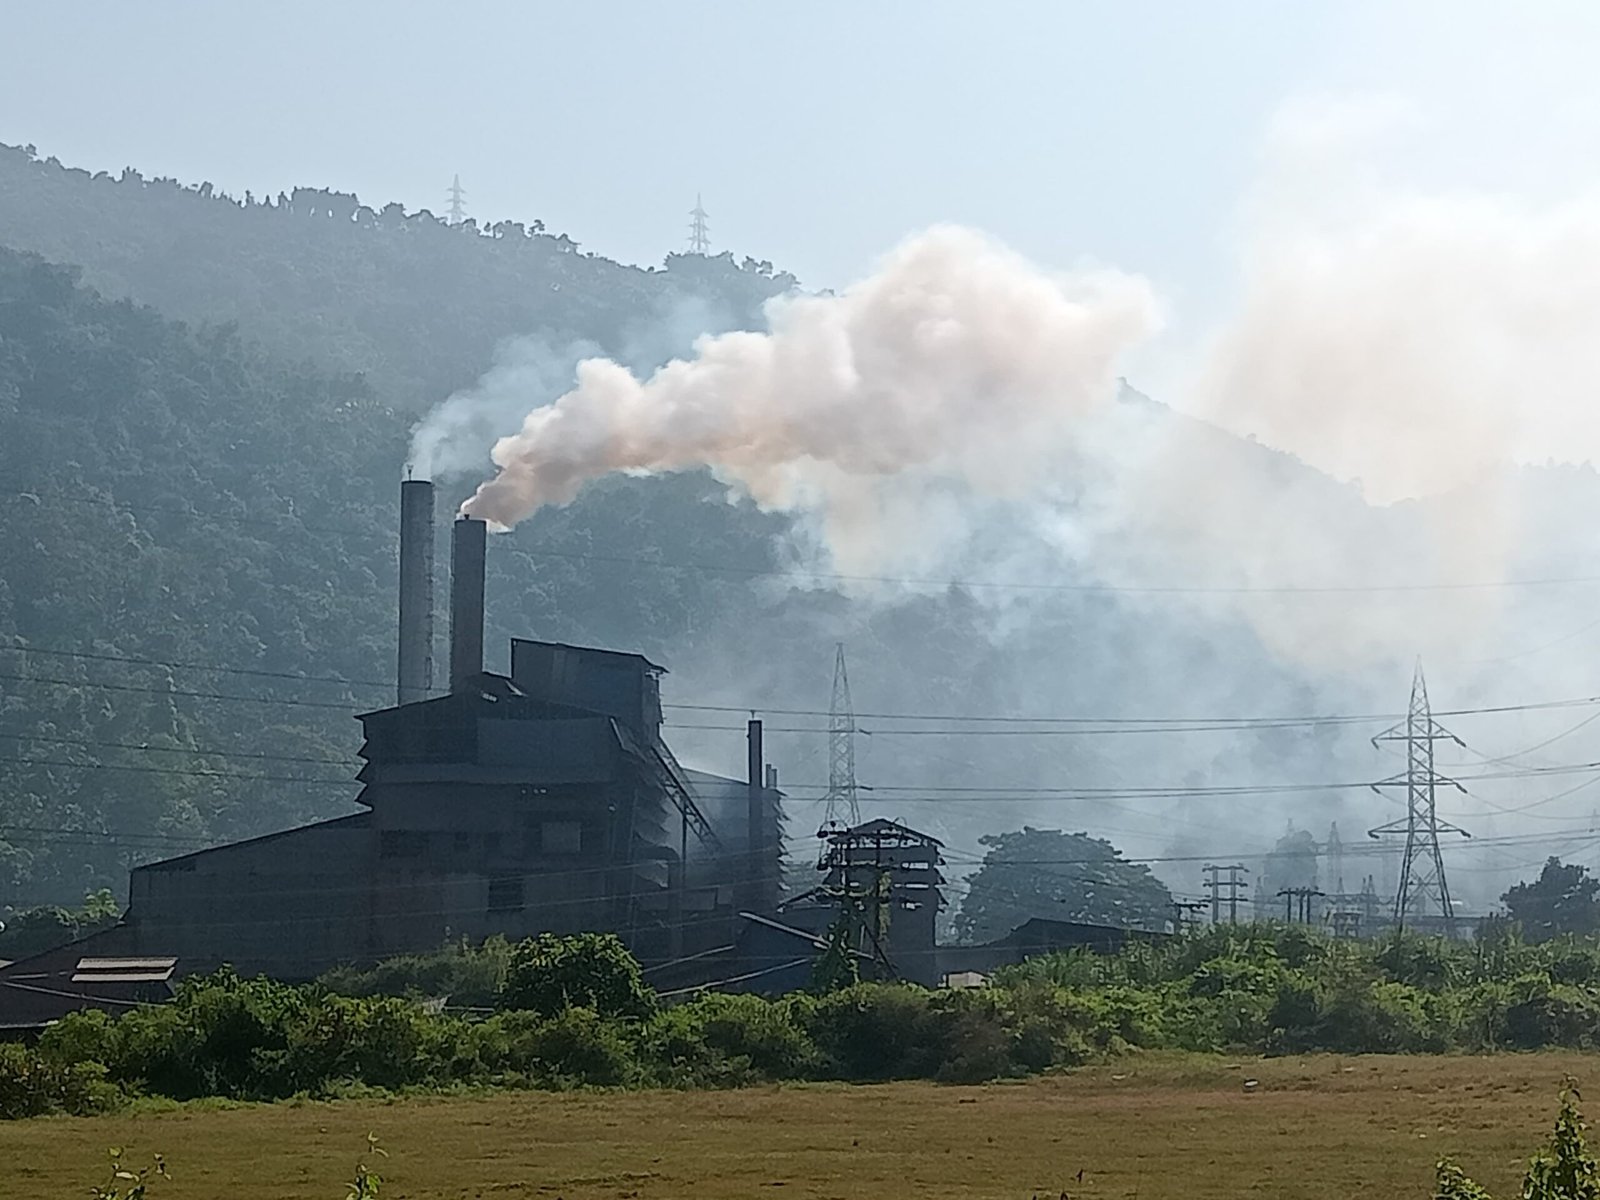
Byrnihat (Assam/Meghalaya, India) — annual PM2.5 ≈ 128 µg/m³ (2024); ranked #1 in 2024. 2025 status: still among the most polluted metros; local authorities and neighbouring states have faced pressure to act.
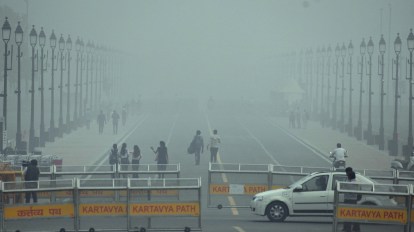
Delhi (India) — capital — longstanding extreme episodes; averaged among the highest for capital cities (Delhi remains one of the most polluted capitals in 2024–25). 2025 status: still in top polluted capitals and recurring winter spikes trigger emergency measures.
Karaganda / other industrial cities (Central Asia) — repeated high ranks in some years. 2025 status: episodic but very high due to industry and coal.
Mullanpur / other Punjab towns (India) — industrial and construction emissions; seasonal agricultural burning. 2025 status: high PM2.5 in several months.
Lahore (Pakistan) — among top polluted South Asian cities in multiple years. 2025 status: still high winter peaks but some short-term improvements reported when targeted measures were enforced.
Dhaka (Bangladesh) — repeatedly among the worst capitals/metros. 2025 status: among top polluted capital cities; government released national AQM plans late-2024/2025.
7–10. Other recurring entries: several Indian industrial towns (Faridabad, Ghaziabad, Patna, Gurugram), cities in Bangladesh and parts of Africa/West Asia depending on year and monitoring coverage. (IQAir’s 2024 report listed many Indian towns across the top 20; coverage expansion in 2024–25 also changed country-level positions).
Key point: IQAir 2024 shows a heavy concentration of the most polluted cities in South Asia (India, Pakistan, Bangladesh) with the single most polluted city in 2024 recorded at Byrnihat, India. Changes into 2025 show that many of the same cities remain in the high-pollution group (seasonal spikes in winter continue to push AQI into hazardous bands).
Why some cities improved (case studies and mechanisms)
Several clear patterns explain why cities such as many in China — and a subset elsewhere — saw large, measurable improvements.
China: policy-driven, aggressive emission cuts
• Policy packages (2013 “Air Pollution Prevention and Control Action Plan” and follow-ups): after 2013 China implemented coordinated national and regional measures — retire old coal plants, close/clean heavy industrial sources, switch residential heating/fueling, enforce vehicle emission standards, and restrict high-emitting industries. Peer-reviewed studies and national statistics document large reductions in PM2.5, SO₂ and NOx in the 2013–2020 window; one high-impact study estimated national population-weighted PM2.5 exposure fell by ~40% between 2013 and 2021, and city-level averages fell substantially. The policy success is attributed to strict central guidance, measurable local targets, enforcement, and industrial restructuring.
Other improving drivers (examples worldwide):
• Cleaner fuels and stations — LPG/LNG or distributed clean heating replaced household coal/biomass in many locales.
• Vehicle regulation and scrappage / emission standards — Euro-equivalent standards, vehicle inspections, and low-emission zones reduce traffic emissions.
• Industrial upgrading + relocation — moving or upgrading high-emission factories, and installing pollution control tech (flue-gas desulfurization, fabric filters).
• Weather-independent reductions — cities that cut emissions year-round show durable improvements rather than seasonal drops tied to weather. (See PNAS/Nature studies on drivers in China.)
Why some cities worsened or stagnated
Cities with little progress or worsening AQI typically share one or more of these characteristics:
Rapid urbanization without clean infrastructure: fast growth of vehicles, construction, and informal industry outpaces emissions controls (common in South Asia and parts of Africa).
Reliance on low-quality fuels: households and small businesses still use biomass, coal, or poor-quality diesel; brick kilns and small industrial boilers persist without controls.
Agricultural residue burning and transboundary pollution: seasonal stubble burning in agricultural belts (e.g., parts of India/Pakistan) produces massive winter plumes that concentrate under inversion conditions in cities downwind.
Weak enforcement and institutional fragmentation: policy exists but enforcement is inconsistent; monitoring networks are incomplete so solutions are poorly targeted.
Geography and meteorology: bowl-shaped basins and winter inversions trap pollutants (this explains some persistently bad micro-regions).
Economic and political trade-offs: some governments prioritize short-term industrial output and energy production over emissions controls, or lack finance to retrofit polluting sources. World Bank and regional reports document these structural constraints.
What governments are doing in 2025 (major policy instruments)
National & regional policy categories (examples & evidence):
• National action plans with city targets: India’s National Clean Air Programme (NCAP) (launched 2019, upgraded targets toward 40% reductions by 2026 in priority cities) directs city action plans and finance for implementation; progress reports show mixed results and many cities still miss interim targets.
• Graded Response / emergency measures: many governments operate seasonal or emergency frameworks (Delhi’s GRAP for the NCR is an example) that temporarily restrict construction, manage traffic, and ban dirty fuels during severe episodes. These protect public health but are not substitutes for year-round controls.
• Sectoral regulations: tighter vehicle emission standards, cleaner fuel mandates, brick-kiln upgrades, industrial emission-control requirements (FGD, baghouses), and controls on power and cement sectors. China’s APPCAP and follow-up Blue-Sky Actions are clear examples of sectoral enforcement that cut PM2.5 at scale.
• Monitoring expansion and transparency: more cities and countries are deploying monitors and publishing real-time AQI to enable targeted responses and build public pressure (IQAir and government portals have expanded coverage).
• Urban planning & transport policy: investment in mass transit, bus rapid transit, bike lanes, low-emission zones and electric vehicle incentives. International city networks (C40, ICLEI) encourage these actions.
What citizens and civil society are doing (2025 snapshot)
• Behavioral & protective responses: use of masks (N95/FFP2), indoor air purifiers, reduced outdoor activity on high-AQI days. These reduce exposure but do not reduce emissions.
• Local campaigns and litigation: civil society often pushes for enforcement — public interest litigation, community monitoring, and grassroots campaigns have pressured authorities to act (e.g., monitoring networks in India and Pakistan, air-quality litigation).
• Changes in travel and consumption: carpooling, modal shifts to public transit and cycling where options exist; greater consumer interest in cleaner appliances and cookstoves.
• Citizen monitoring and data activism: NGOs and academics deploy low-cost sensors to create independent maps that highlight hotspots and accountability gaps. These datasets have been influential in exposing local sources and prompting targeted action.
Concrete examples of measures and early results
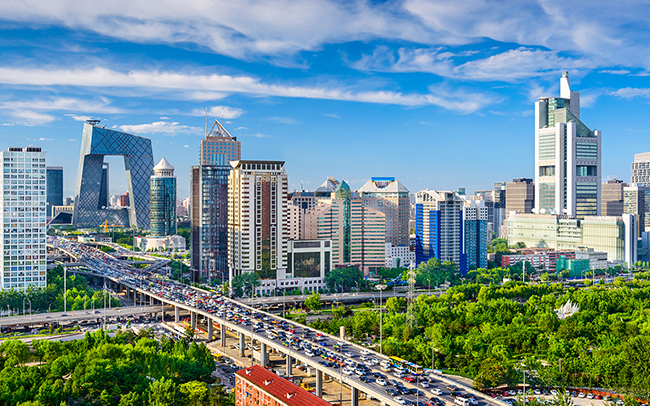
• Beijing / China (improvement): Multi-year nationwide actions (2013 Action Plan, follow-ups) drove large PM2.5 reductions — studies estimate average PM2.5 in many Chinese cities dropped by ~30–40% between 2013–2020, with large health benefits projected. The policy mix included coal-to-gas/heating fuel switches, industrial closures/relocations, and strict vehicle standards.
• Delhi / India (partial progress + recurring failure modes): India’s NCAP and city action plans created targets and interventions (dust control, traffic measures, brick-kiln regulations). Yet seasonal drivers (stubble burning, winter inversions) + insufficient enforcement mean Delhi still experiences severe winter episodes — prompt emergency GRAP activations remain common. NCAP reporting shows some city-level gains but not yet the scale required to meet WHO levels.
• Byrnihat / small industrial towns (high exposure): Small industrial clusters with heavy road freight, many small furnaces and bowl topography have produced extremely high PM2.5 in 2024–25, with local public health impacts and calls for inter-state responses.
Policy lessons from the last 20 years — what works, what doesn’t
What works
• National targets + enforceable local action (China’s model): centrally set goals with local accountability, backed by monitoring and funding, can produce rapid change.
• Sector-specific controls (coal, industry, brick kilns, vehicles) and fuel switching reduce large sources quickly.
• Transparent monitoring and public data — when citizens can see AQI in real time, political pressure for action rises and individual exposure can be reduced.
What is insufficient
• Emergency-only responses (odd-even or single-event bans) without year-round controls only give temporary relief.
• Fragmented governance — lack of coordination across jurisdictions (common in metro regions) undermines effectiveness.
Practical recommendations
For governments
Expand and sustain continuous monitoring (high spatial density + public dashboards).
Set measurable, time-bound targets for PM2.5 and NO₂ aligned with health goals; make local budgets contingent on progress (performance financing).
Target largest sources first (coal, heavy industry, brick kilns, diesel freight) with enforceable timelines and funding for cleaner alternatives.
Strengthen regional coordination for transboundary sources (stubble burning, industrial plumes).
For citizens & civil society
Use real-time AQI to reduce exposure (stay indoors on hazardous days, use certified masks/purifiers).
Advocate for transparency and local enforcement; support deployment of independent low-cost sensors to find hotspots.
Reduce driving (carpool, public transit, active transport) and demand cleaner local fuels for households and small businesses.
Conclusion — the 20-year verdict
From 2005–2025 the global story of urban air quality is uneven: dramatic, policy-driven improvements in some countries (notably China) coexist with persistent or worsening exposures in many South Asian and several African and Middle Eastern cities. Monitoring coverage and data transparency have improved — enabling better policy — but most of the world’s population continues to breathe air above WHO guideline levels. Reaching WHO targets will require sustained, multi-sectoral action, focused finance and enforcement, and active citizen engagement.
You may Also Like

How to Build Credit with a Secured Credit Card: A Beginner's Step-by-Step Guide to Building a Strong Credit Score

Can You Make a Consistent Monthly Income from Betting? The Best Skill-Based Betting Platforms and Strategies